There was an issue validating your request. Please try again later.

Campus paving begins April 15. Please refer to the Helpful Info page for updates regarding temporary changes to campus access. Trails remain open.

The Wrack

The Wrack is the Wells Reserve blog, our collective logbook on the web.

By the Numbers: January 2024 Water Levels

Posted by | February 2, 2024 | Filed under: Observations

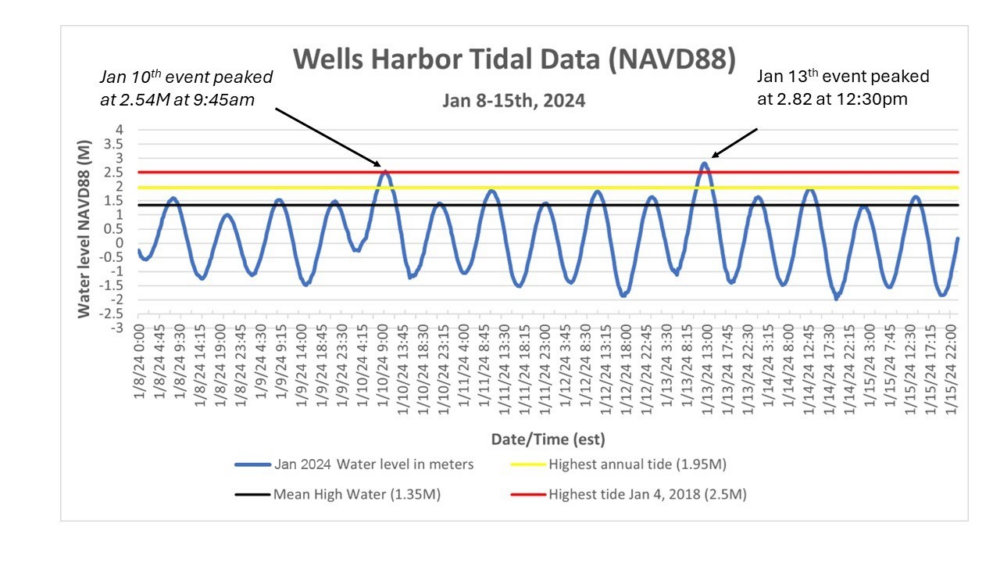
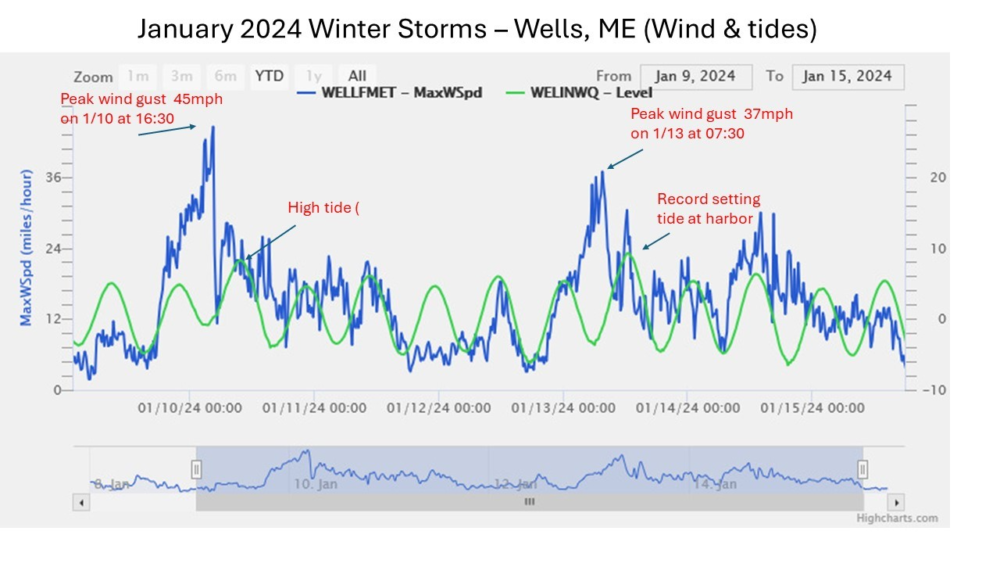
You didn't think I was going to let those coastal storms march through Maine without a graph or two did ya!? Let's put our last two storms into perspective.

Both the January 10 and January 13 events broke our old water level record measured at Wells Harbor back in January 2018. Data for water level at this site go back to 1996, so it's remarkable to have two record-setting incidents in one week. Wind was certainly a factor. Rainfall had less of an impact with these two storms.

Water level data from Wells Harbor (shown in blue). The red line is the old record set back in 2018. The black line is mean high water, or the average high tide for this station. The yellow line represents the "highest annual predicted tide" (often called a king tide) for 2023. Both storms broke our historical water levels for Wells Harbor and were considerably higher than last year's highest predicted tide. This extremely high water level coupled with wind and waves (storm surge) is what caused the coastal damage we experienced this month.
Water level (green line) and wind gusts (blue line). We were lucky our peak wind gusts (45mph and 37mph) hit before dead high tide! That likely saved us from even more storm surge. Had those highest winds been in line with the highest tides, bolstered by more than 2 inches of rain during each event,... YIKES!

Hope you enjoyed this latest installment of "By the Numbers," brought to you by your friendly local SWMP manager. I'm working on getting this data (and future data) displayed in feet and linked to tidal predictions to make it easier to understand. Stay tuned.


← View all Blog Posts